
Looking for a 45-70 ballistics chart to 1,000 yards? You can find complete comparison tables below for three specific commercial loads: Federal Fusion 300-grain, Remington Core-Lokt 405-grain, and Hornady LEVERevolution 250-grain MonoFlex. Each table shows modeled bullet drop, remaining velocity, and retained energy from the muzzle to 1,000 yards. We also include published Hornady 325-grain FTX and Federal HammerDown specifications, so you can see where manufacturer data ends and long-distance calculations begin.


The essential distinction: a projectile reaching 1,000 yards is not the same thing as a responsible 1,000-yard hunting shot. These calculations are informational models; actual performance changes with the exact ammunition lot, rifle, barrel, altitude, temperature, wind, and observed field results.
Quick answer: In the independent models cited below, Federal Fusion 300-grain ammunition is moving about 767 fps with 392 ft-lb remaining at 1,000 yards; the 405-grain Remington Core-Lokt is at 722 fps / 469 ft-lb; and Hornady’s 250-grain MonoFlex is at 593 fps / 195 ft-lb. All three have extremely curved trajectories at that distance. The published numbers are not field-verified shooting solutions. Sources: Federal model, Remington model, Hornady model.
45-70 Ballistics Chart to 1,000 Yards
There is no single universal .45-70 Government trajectory. A lightweight 250-grain bullet, a conventional 300-grain bullet, and a slower 405-grain bullet start with different speeds and lose velocity at different rates. A meaningful comparison therefore identifies the exact load rather than labeling every row simply “45-70.”
These three comparison tables use modeled results from Ballistics Board under the same stated conditions: a 100-yard zero, sea-level atmosphere, 59°F, and a 10-mph full-value crosswind. The trajectory table below lists vertical impact relative to the sight line, not bullet movement from the bore line. Each load has its own published G1 ballistic coefficient; the simulations remain estimates. Federal dataset · Remington dataset · Hornady dataset.
Original plot of independent 100-yard-zero model results. Higher values mean a greater vertical difference below the sight line; do not use as an unverified aiming chart.
Modeled vertical impact relative to a 100-yard zero (inches) — negative means below the sight line
| Yards | 300 gr Federal Fusion | 405 gr Remington Core-Lokt | 250 gr Hornady MonoFlex |
|---|---|---|---|
| 0 | -1.5 | -1.5 | -1.5 |
| 100 | 0 | 0 | 0 |
| 200 | -12 | -16.8 | -12.2 |
| 300 | -42.1 | -57.6 | -45.9 |
| 400 | -95.5 | -128.2 | -110.3 |
| 500 | -178.1 | -234.2 | -214.1 |
| 600 | -295.2 | -380.5 | -365.1 |
| 700 | -451.8 | -572.2 | -571.8 |
| 800 | -652.7 | -814.4 | -843.4 |
| 900 | -902.7 | -1,112.2 | -1,190.3 |
| 1,000 | -1,207 | -1,471.5 | -1,624.5 |
The numbers separate quickly after 300 yards. At 500 yards, the models show about 178 inches of drop for Federal’s 300-grain load, 234 inches for the 405-grain Remington load, and 214 inches for Hornady’s 250-grain load. At 1,000 yards, the corresponding figures are roughly 101, 123, and 135 feet below the 100-yard sight line. This is why a 200- or 300-yard manufacturer chart should never be extended to 1,000 yards with a straight-line calculation.
45-70 Velocity and Energy Chart: 0–1,000 Yards
Velocity is measured in feet per second (fps). Energy is measured in foot-pounds (ft-lb), a calculation based on projectile mass and velocity rather than a direct measure of terminal performance. Two bullets with similar energy may still behave differently because construction, impact speed, and the target medium matter.
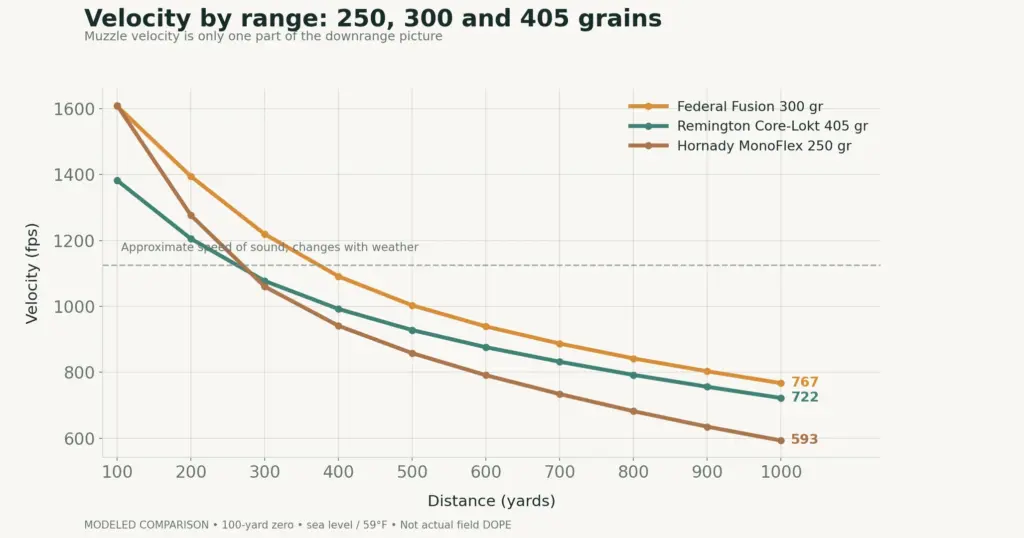
Modeled velocities. The dashed speed-of-sound line is approximate; local temperature changes the sonic threshold.
Modeled remaining bullet velocity (fps)
| Yards | 300 gr Federal Fusion | 405 gr Remington Core-Lokt | 250 gr Hornady MonoFlex |
|---|---|---|---|
| 0 | 1,850 | 1,600 | 2,025 |
| 100 | 1,607 | 1,382 | 1,609 |
| 200 | 1,394 | 1,205 | 1,276 |
| 300 | 1,219 | 1,077 | 1,060 |
| 400 | 1,091 | 992 | 941 |
| 500 | 1,003 | 928 | 858 |
| 600 | 939 | 876 | 791 |
| 700 | 887 | 832 | 734 |
| 800 | 842 | 792 | 682 |
| 900 | 803 | 756 | 635 |
| 1,000 | 767 | 722 | 593 |
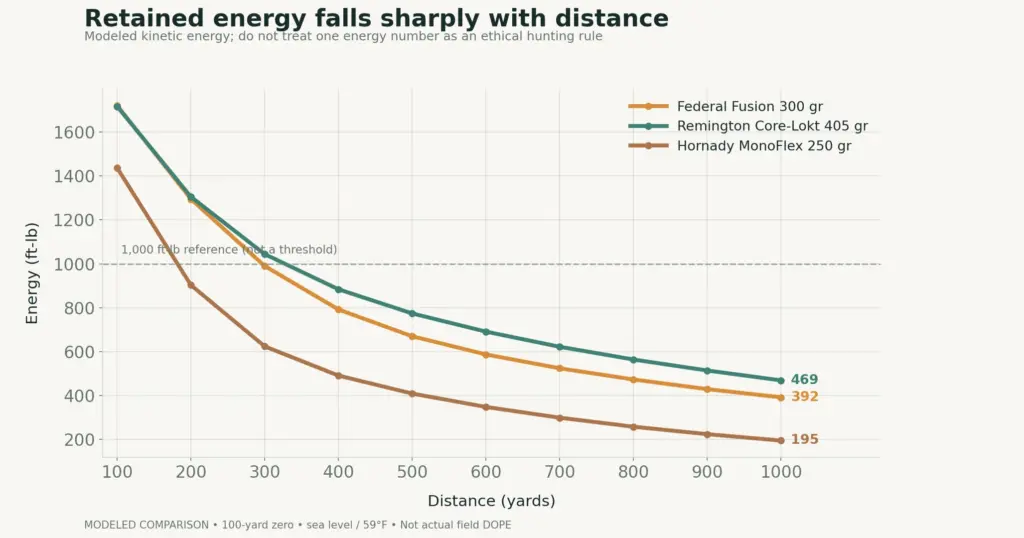
Kinetic energy is a useful comparison metric, not a universal ethical hunting cutoff. The horizontal reference line is explanatory only.
Modeled remaining kinetic energy (ft-lb)
| Yards | 300 gr Federal Fusion | 405 gr Remington Core-Lokt | 250 gr Hornady MonoFlex |
|---|---|---|---|
| 0 | 2,279 | 2,302 | 2,276 |
| 100 | 1,721 | 1,717 | 1,437 |
| 200 | 1,295 | 1,305 | 903 |
| 300 | 990 | 1,044 | 624 |
| 400 | 792 | 884 | 491 |
| 500 | 670 | 774 | 409 |
| 600 | 587 | 691 | 348 |
| 700 | 524 | 622 | 299 |
| 800 | 473 | 564 | 258 |
| 900 | 429 | 514 | 224 |
| 1,000 | 392 | 469 | 195 |
At 1,000 yards: three modeled load profiles
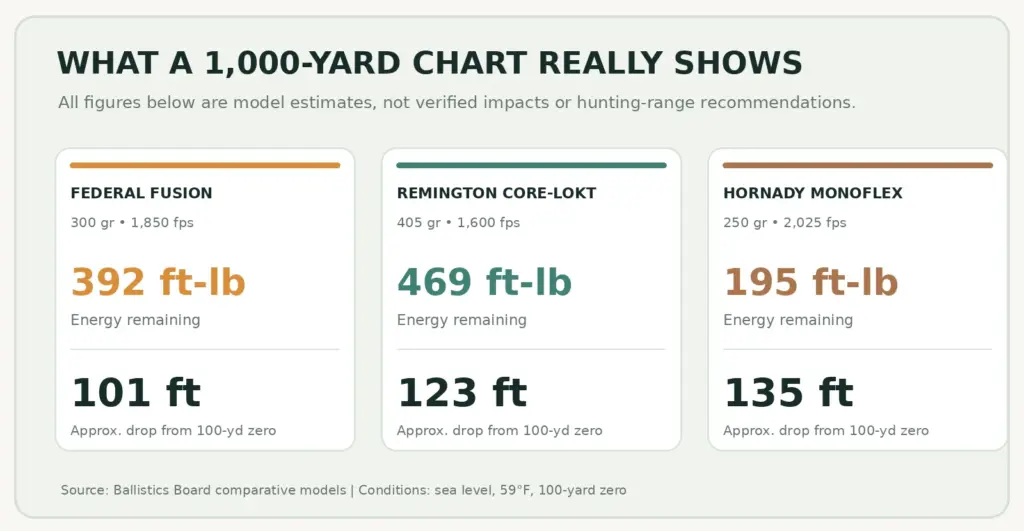
Shareable original infographic. Model outputs are approximations for comparison—not actual long-range shot verification.
Relative to the listed muzzle figures, these models show energy reductions of approximately 83% for the Federal 300-grain load, 80% for the 405-grain Remington load, and 91% for the 250-grain Hornady load at 1,000 yards. These percentages describe only the three specified products and their modeled trajectories, not every round of .45-70 ammunition.
Manufacturer-Published Ballistics: 325-Grain Hornady FTX and 300-Grain Federal HammerDown
Manufacturer data is the more appropriate starting reference for common factory ammunition. It also demonstrates an important limitation of many searches for a “45-70 ballistics chart 1000 yards”: factories frequently publish data only to 300 or 500 yards. Extending those tables farther requires a model with stated assumptions, followed by real-world verification at an appropriately managed range.
Hornady LEVERevolution 325-Grain FTX (product 82747)
Hornady’s 2025 catalog lists the 325-grain FTX at 2,000 fps and 2,886 ft-lb at the muzzle. Its 200-yard-zero factory table reports a 300-yard velocity of 1,197 fps, energy of 1,035 ft-lb, and trajectory of 23 inches below the sight line. Do not confuse that 200-yard-zero trajectory with the 100-yard-zero charts above. Some older references show a different 2,050-fps test load, which is another reason to check the exact product and catalog edition. Hornady 2025 catalog (PDF mirror).
Hornady LEVERevolution 325 gr FTX — published specifications (200-yard zero)
| Range | Velocity (fps) | Energy (ft-lb) | Path (in) |
|---|---|---|---|
| Muzzle | 2,000 | 2,886 | −1.5 |
| 100 yd | 1,685 | 2,049 | +5.5 |
| 200 yd | 1,413 | 1,441 | 0 |
| 300 yd | 1,197 | 1,035 | −23.0 |
Federal HammerDown 300-Grain: Published Velocity Through 500 Yards
Federal’s 2026 catalog lists HammerDown product LG45701 at 1,850 fps with a 0.290 G1 ballistic coefficient. It publishes velocity through 500 yards, but it does not provide a factory-verified 1,000-yard trajectory. Notice that the modeled Federal Fusion table above uses a different commercial product with similar catalog inputs; do not treat its model numbers as a verified HammerDown trajectory. Federal 2026 catalog (PDF).
Federal HammerDown 300 gr — manufacturer-listed velocity
| Range | Velocity (fps) |
|---|---|
| Muzzle | 1,850 |
| 100 yd | 1,612 |
| 200 yd | 1,401 |
| 300 yd | 1,227 |
| 400 yd | 1,099 |
| 500 yd | 1,011 |
How to Read the .45-70 Numbers
Bullet weight is not the same as a flat trajectory
Grain weight identifies bullet mass, not speed or shape. Hornady’s 250-grain MonoFlex leaves the muzzle fastest of the three modeled examples, but its 0.175 G1 BC is lower than Federal Fusion’s 0.290 G1 BC. By 1,000 yards, the higher-BC Federal example retains more velocity despite starting slower. Bullet weight, initial velocity, shape, and drag behavior have to be considered together. These are load-specific comparisons, not a claim that every 300-grain bullet outperforms every 250-grain bullet.
What is the ballistic coefficient (BC)?
Ballistic coefficient is a drag-related value calculated against a reference projectile model. The example loads are reported using G1 BCs, so we have not mixed G1 and G7 numbers in the table. BC can vary with velocity; a single published number is a convenient estimate, particularly less certain through the transonic region.
Why does the 45-70 trajectory change so much past 300 yards?
The .45-70 Government dates to 1873 and was developed around a large, relatively slow projectile rather than a modern high-BC long-range bullet. Once air resistance reduces its speed, flight time increases and the vertical trajectory becomes much steeper. In the three cited models, all bullets are already below roughly the speed of sound by 400 yards. The exact transonic transition depends on bullet and weather, and solver predictions are less trustworthy when conditions diverge from their assumptions. American Hunter on the .45-70.
Why the tables cannot be mixed and matched
The 325-grain Hornady manufacturer’s chart above uses a 200-yard zero. Our three extended independent tables use a 100-yard zero. Zero distance changes the trajectory relative to your line of sight even when exterior velocity and energy remain the same. Likewise, Federal HammerDown, Federal Fusion, and the older Federal Power-Shok should not be labeled as identical ammunition just because some versions share a 300-grain bullet and an 1,850-fps listed muzzle velocity.
Is the 45-70 a 1,000-Yard Hunting Cartridge?
It is possible for a .45-70 projectile to travel 1,000 yards, and target shooters have explored very long distances with appropriate equipment. But a long trajectory calculation does not establish a humane hunting distance. The modeled energy, flight path, and sensitivity to conditions shown here make that distinction especially important for this cartridge.
Before hunting with any rifle, the relevant questions are whether the ammunition is designed to expand or penetrate appropriately at its actual impact velocity, whether you can consistently place shots under comparable field conditions, whether you have an unobstructed and safe backstop, and whether taking the shot is legal where you hunt. American Hunter’s field-position practice guidance recommends assessing personal capability at realistic distances rather than assigning every hunter a universal range limit.
For most readers, the useful takeaway is to treat this as a cartridge for comparatively short-to-moderate hunting distances with the exact load and shooting conditions setting the limits—not to turn a modeled 1,000-yard chart into a hunting plan. If you are choosing your first rifle, see our guide to deer-hunting rifle considerations.
Confirm the exact load and rifle compatibility
Not all .45-70 rifles are interchangeable with all .45-70 ammunition. Antique trapdoor rifles and many modern lever actions or strong single-shots have different strength limits. Use only ammunition the firearm manufacturer approves for your exact model, and never extrapolate from a hot-load advertisement or a different rifle. Hornady explains that its elastomer-tipped FTX design is made for suitable tubular-magazine applications; that design feature does not override the rifle maker’s ammunition restrictions. Hornady Flex Tip explanation.
Understanding optics is a separate topic. Our related guides cover what a 200-yard zero means, scope elevation terminology, and windage fundamentals.
Frequently Asked Questions
How much does a 45-70 drop at 1,000 yards?
There is no single number. With a modeled 100-yard zero, the three named examples here range from about 1,207 to 1,625 inches of vertical displacement at 1,000 yards. These estimates are not interchangeable across ammunition brands, rifles, weather, and sight settings.


How much energy does a 45-70 have at 1,000 yards?
The models for this article show approximately 195–469 ft-lb across three specified loads. That is a comparison range for these products only, not a cartridge-wide guarantee.
What is the 45-70 bullet drop at 300 yards?
With a modeled 100-yard zero, the three example loads are about 42–58 inches low at 300 yards. Separately, Hornady’s factory-published 325-grain FTX example is 23 inches low at 300 yards using its 200-yard zero. The difference in zero is critical.
Is 45-70 ammunition supersonic at 1,000 yards?
None of the three modeled loads in this guide is supersonic at 1,000 yards. Their estimated remaining velocities are between 593 and 767 fps, well below the approximate speed of sound in ordinary surface conditions.
Does a 325-grain FTX shoot flatter than a traditional 405-grain bullet?
Under comparable assumptions, its faster muzzle velocity and FTX design generally produce a less curved trajectory over the shorter ranges emphasized in the manufacturer charts. However, the exact answer depends on which 405-grain load you compare, and zero settings must match before interpreting any drop difference.
Can I use this as a 1,000-yard scope adjustment card?
No. These are third-party comparison models, not a validated firing solution for a specific rifle and ammunition lot. Any range activity must comply with facility rules and use an adequate backstop, and ethical hunting distance is much shorter than the maximum distance a projectile can travel.
Sources, Image Credits & Methodology
Editorial method: Manufacturer specifications are separated from independent computer-modeled projections. Modeled tables and original visuals were transcribed or replotted from the three named Ballistics Board load pages as checked on September 24, 2026. We have not fired these loads, chronographed them, or independently validated the source’s solver at 1,000 yards. Rounding appears in chart labels, while tables retain the source’s reported precision.
- Ballistics Board — Federal Fusion 300 gr .45-70: modeled 100-yard-zero data
- Ballistics Board — Remington Core-Lokt 405 gr: modeled 100-yard-zero data
- Ballistics Board — Hornady LEVERevolution 250 gr MonoFlex: modeled data
- Federal Premium — 2026 ammunition catalog: HammerDown 300 gr published velocities
- Hornady — 2025 product catalog (third-party PDF mirror): 325 gr FTX published values
- American Hunter — 45-70 cartridge history and hunting trajectory discussion
- American Hunter — guidance on determining personal ethical shooting distance
- Optional public-domain .45-70 cartridge photo by Ryan D. Larson on Wikimedia Commons

Leave a Reply